close all
clear all
global r1
global r2
global r3
global r4
r1=120;
r2=40;
r3=140;
r4=80;
theta1=0;
omega2=600*(2*pi/60);
for i=1:37
theta2(i)=(i-1)*10*(pi/180);
a(i)=r1*cos(theta1)-r2*cos(theta2(i));
b(i)=r1*sin(theta1)-r2*sin(theta2(i));
c(i)=(r3^2-a(i)^2-b(i)^2-r4^2)/(2*r4);
theta41(i)=2*atan2((b(i)+sqrt(a(i)^2+b(i)^2-c(i)^2)),(a(i)+c(i)));
theta42(i)=2*atan2((b(i)-sqrt(a(i)^2+b(i)^2-c(i)^2)),(a(i)+c(i)));
d(i)=(r3^2+a(i)^2+b(i)^2-r4^2)/(2*r3);
theta31(i)=2*atan2((b(i)+sqrt(a(i)^2+b(i)^2-d(i)^2)),(a(i)+d(i)));
theta32(i)=2*atan2((b(i)-sqrt(a(i)^2+b(i)^2-d(i)^2)),(a(i)+d(i)));
xa(i)=r2*cos(theta2(i));
ya(i)=r2*sin(theta2(i));
xb1(i)=r1*cos(theta1)+r4*cos(theta41(i));
yb1(i)=r1*sin(theta1)+r4*sin(theta41(i));
xb2(i)=r1*cos(theta1)+r4*cos(theta42(i));
yb2(i)=r1*sin(theta1)+r4*sin(theta42(i));
x(1,i)=0;
y(1,i)=0;
x(2,i)=xa(i);
y(2,i)=ya(i);
x(3,i)=xb1(i);
y(3,i)=yb1(i);
x(4,i)=r1*cos(theta1);
y(4,i)=r1*sin(theta1);
x2(1,i)=0;
y2(1,i)=0;
x2(2,i)=xa(i);
y2(2,i)=ya(i);
x2(3,i)=xb2(i);
y2(3,i)=yb2(i);
x2(4,i)=r1*cos(theta1);
y2(4,i)=r1*sin(theta1);
omega3(i)=r2*omega2*sin(theta2(i)-theta41(i))/(r3*sin(theta41(i)-theta31(i)));
omega4(i)=r2*omega2*sin(theta2(i)-theta31(i))/(r3*sin(theta41(i)-theta31(i)));
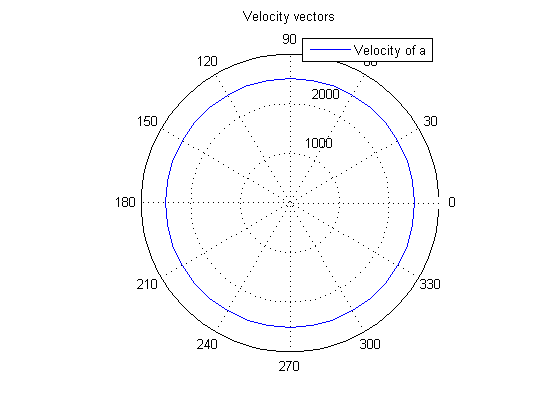
va(i)=r2*omega2;
theta2v(i)=theta2(i)+pi/2;
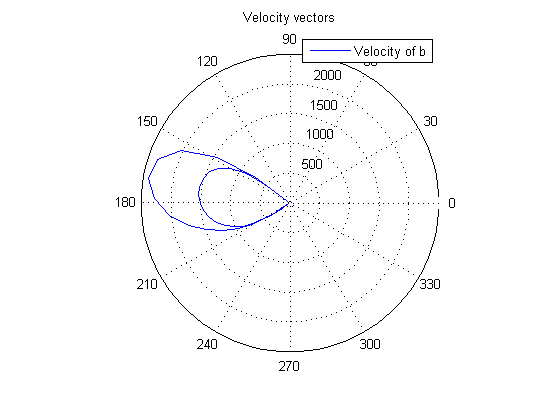
vb(i)=r4*omega4(i);
if omega4(i)<0
thetabv(i)=theta41(i)-pi/2;
else
thetabv(i)=theta41(i)+pi/2;
end;
end;
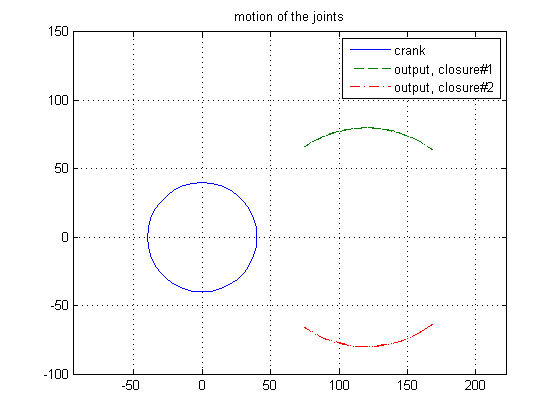
plot(xa,ya,xb1,yb1,'--',xb2,yb2,'-.')
legend('crank','output, closure#1','output, closure#2')
axis([-50 200 -100 150])
title ('motion of the joints')
axis equal
grid on
figure
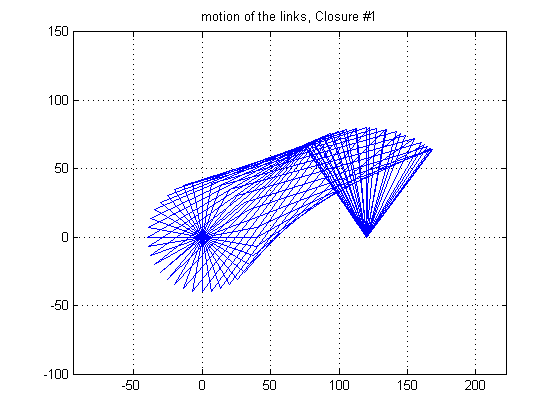
for i=1:37
plot(x(1:4,i),y(1:4,i))
hold on
end;
axis([-50 200 -100 150])
title ('motion of the links, Closure #1')
axis equal
grid on
figure
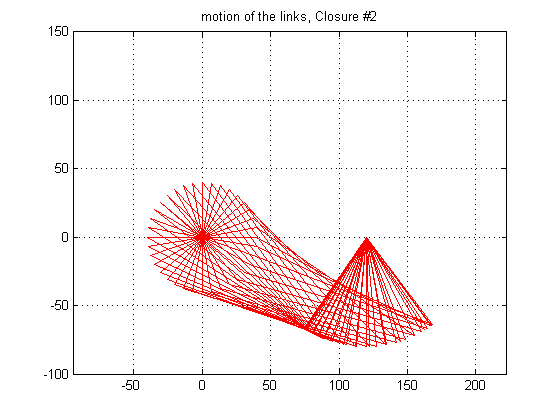
for i=1:37
plot(x2(1:4,i),y2(1:4,i),'r')
hold on
end;
axis([-50 200 -100 150])
title ('motion of the links, Closure #2')
axis equal
grid on
figure
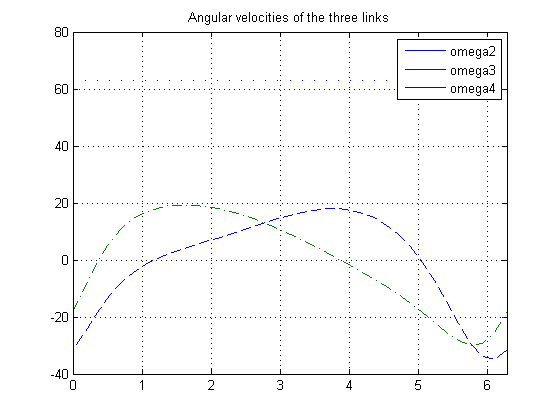
plot(theta2,omega2,'b-',theta2,omega3,'--',theta2,omega4,'-.')
legend('omega2','omega3','omega4')
axis([0 2*pi -40 80])
title ('Angular velocities of the three links')
grid on
figure
polar(theta2v,va)
legend('Velocity of a')
title ('Velocity vectors')
grid on
figure
polar(thetabv,vb)
legend('Velocity of b')
title ('Velocity vectors')
grid on